
How to discover the wicked vicious circles in your workflow?
Stuck in repetitive workflow issues? Learn to spot and fix vicious cycles with this practical guide.
Vicious circles?

It was during last Christmas lunch, or during any Sunday family event. Your uncle Dave and your brother-in-law Bob started to discuss. The discussion was about Covid (or the education system, or the level of taxes, or the choices of the national football team coach). What you clearly remember is the overheating tone and the strong opinions that would never converge.
You can see the picture, right? We all witnessed such an opinion-based conversation… And let us be honest, we even took part in one of them. Most of these conversations go nowhere.
Yet, what they illustrate is the following: we all think we excel at knowing “what the real problem is”. We all believe we are excellent at identifying root causes of dysfunctions. Every one of us has an opinion about “why things are not working properly”.
The truth is, we are quite good at finding causes of dysfunctions. Yet, while each root-cause contributes to a dysfunction, there are plenty of causes to problems that are complex by nature. So, we all can point at one or two causes and easily think is THE problem. But what if there were plenty of root causes, and what if they were highly interrelated?

This is what is happening when you are on a journey to improve your workflow:
- You want to identify the root causes of the dysfunctions and fix them.
- The bad news is that there is more than one root cause. There are plenty of them.
- And the worst news is these root causes are all linked.
Fortunately, this post shows you how to visualize links between the many causes and consequences. In case you want to know, this visual representation mobilizes basic concepts of systems modelling. But don’t worry and keep reading, it is simpler than what the name indicates!
Visualizing your workflow is an entry door to identifying the vicious circles in your workflow. Remember the overheated conversation between Dave and Bob . The vicious circle probably started when Dave answered Bob with a strong opinion-based statement, to which Bob counter-attacked, making Dave pump up the volume, etc.
Here, you have what is called a causal loop: a cause, creating an effect that becomes a cause to another effect and so on, in a loop.
We call this type of causal loop a vicious circle because it has undesired effects that often persist over time.
Causal loops are present in your workflow. Let’s see how to identify them.
Here are the steps:
- Step 1: Introduce the concept of Variables
- Step 2: Have the participants identify the variables of the workflow.
- Step 3: Introduce the concept of causal loops.
- Step 4: Create a simple causal loop diagram.
Let us detail each of these steps.
Step 1: introduce the concepts of variables.
For example, you can say: “Variables are characteristic elements in your workflow that can change or impact the overall process, for example:
- Number of people involved.
- Time to take a decision.
- Time to get feedback.
- Time to correct.
- Work in progress.
Variables are things that you can measure or observe. They can be quantities, duration. They can also be information in a broad meaning, or characteristics of relationships.
They influence how your workflow operates. We use variables to help us understand the different factors at play in your workflow.”
Step 2: Have the participants identify the variables in their workflow .
As you introduced the concept of variables, now ask the participants to identify the variables for the workflow.
- Give them 5 minutes alone to list these variables on stickies.
- Ask them to join in groups of two for 5 minutes.
- You can potentially do another round by having groups of two merge to form groups of four.
- Have them display the list of post-its on the wall.
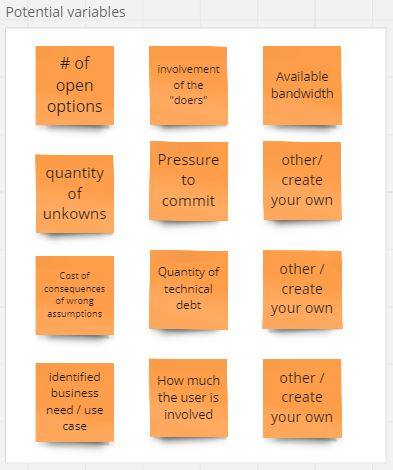
Tip: if participants get blocked at the start, show them a list of potential variables, for inspiration.
At each round, ask participants to
- Remove duplicates.
- Clarify the name if it is not self-explanatory.
- Check that all variables can be measured or observed. Reformulate and find the variable otherwise.
- Extend the initial list. Ending up with a list of 5 to 15 variables sounds realistic.
Step 3: explain the concept of causal loops.
A bit of storytelling is welcome here:
“Suppose you invest one hundred € on an account with a 5% annual interest rate. After a year you own 105 €. After 2 years you own 110.25 €, etc. The more you invest, the more extra capital you get. And the more extra capital you get, the more you can invest. It is a reinforcing loop.
Let us take another example. In a retail store, as stock levels decrease due to sales, the store places orders to restock inventory. It is a balancing loop. Less stocks -> More orders -> More stock
Reinforcing or (positive feedback loops) can lead to exponential growth or decline, while balancing loops (or negative feedback loop) tend to maintain stability. They often interact.”
Step 4: Create a simple causal loop diagram.
Your role now, as a facilitator, is to have participants draft causal feedback loops between the different variables they identified in the previous step. To do this, our advice is to do an example with them.
Pick a variable from their list randomly. Suppose you pick “Work in Progress”. Ask them:
“if you have more Work in Progress, what other variable will be affected?”. “Time to correct a defect” could be one.
Then ask them:
iI “Time to correct” is higher, what will increase? They will probably say “Work in Progress”, or something else.
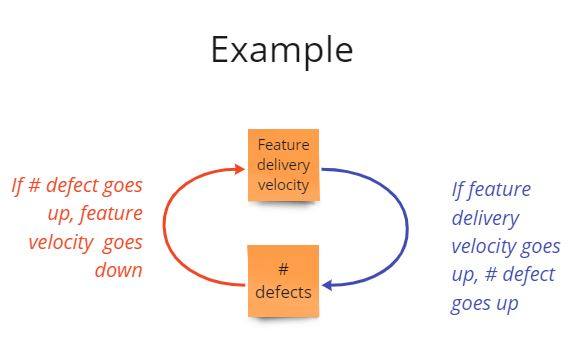
Use the color coding from the previous image. Red for reinforcing loops, blue for balancing loops, green when the direction is unknown
In small groups of 3 to 5, ask participants to continue this activity by adding variables and relationships.
The goal of this activity is not to reach the perfect model of their workflow. Systems modeling is a whole discipline that we are simplifying for our purpose.
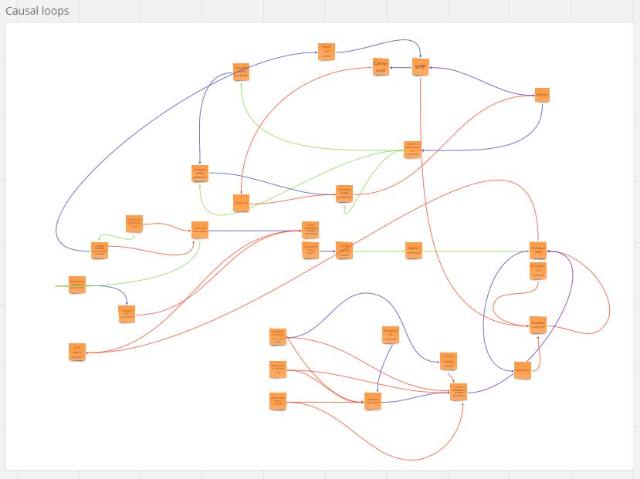
Yet, you will quickly observe each group adding variables, loops, and a shared visual taking shape.
Once this happens, ask participants to check that the links they placed are as direct as possible.
Ask them to erase the ones that could be more direct, or to identify new intermediate variables.
If “A” indirectly affects “C”, would there be an intermediate variable “B” between “A” and “C”? For example, between “Work in Progress” and “Time to correct a defect”, there could be an intermediate variable “Time to acknowledge the defect”.
As mentioned, the goal is not to reach perfect accuracy of the model. The next post explains how to identify the levers to act upon. You will understand the value of having a “good enough” model when reading it.
Bonus extra step: Take a step back and have participants share their learnings at this point.
At this stage, participants may already have come to striking realizations while stepping back on how their work is organized.
The high inter-relatedness of root causes is likely to be one of them!
If you feel the energy is a bit low in the room, give participants 1 min to individually identify their learnings at this point, and ask a few of them to share their reflections. This usually boosts the energy to continue.
This blog post is part of the 1h Event Storming book that we are currently writing.


Leave a comment